Operator Guide: DRO Readouts and Machine Tool Monitoring Software
Train operators to integrate DRO readouts with machine tool monitoring software. Learn calibration, MTConnect protocols, and troubleshooting frameworks.
The modern machine shop relies on continuous data streams to optimize spindle utilization and track part cycle times. However, a critical blind spot often exists on the shop floor: manual and semi-manual machines equipped with Digital Read Out (DRO) systems. While CNC machines natively broadcast telemetry, integrating DRO readouts with machine tool monitoring software requires specific operator competencies to ensure data accuracy, prevent network latency, and maintain linear scale integrity.
As of 2026, edge-computing gateways and IoT-enabled DRO displays (such as the HEIDENHAIN ND 780 series) allow manual mills and lathes to broadcast axis position data via MTConnect or OPC-UA protocols. This guide provides a technical training framework for operators and shop floor managers to bridge the gap between physical DRO hardware and digital monitoring dashboards.
⚠️ Critical Operator Warning: Never ignore a variance alert between the physical DRO display and the monitoring software dashboard. A discrepancy of even 0.0005 inches (12.7 microns) usually indicates linear scale contamination or a network polling desynchronization, both of which will result in scrapped aerospace or medical components if left unaddressed.The Convergence of Legacy DROs and IoT Monitoring
Historically, DRO systems from manufacturers like Newall, Fagor, and Heidenhain operated as closed-loop islands. The operator read the physical LCD display, and the data died there. Today, integrating these readouts into machine tool monitoring software (such as MachineMetrics or Scytec DataXchange) transforms manual machines into trackable assets.
This integration relies on extracting positional data from the DRO's serial or Ethernet port and translating it into standardized XML tags. Operators must understand that the monitoring software is only as accurate as the physical linear scales feeding the DRO head. If a glass scale is coated in coolant mist, the DRO will display the wrong position, and the monitoring software will log false cycle times and inaccurate tool paths.
DRO Scale Technologies and Software Integration Matrix
Operators must be trained to identify which scale technology is installed on their machine, as this dictates the maintenance schedule and the expected data resolution in the monitoring software.
| Scale Technology | Common Brands / Models | Resolution & Accuracy | Monitoring Integration Risk Factors |
|---|---|---|---|
| Glass (Optical) | Heidenhain LS, Easson | 1µm to 5µm | High risk of coolant/chip ingress causing signal drops; requires frequent physical cleaning to maintain software data continuity. |
| Magnetic (Inductive) | Newall Spherosyn, Balluff | 5µm to 10µm | Immune to coolant and dust. Lowest risk for monitoring software dropouts; ideal for high-vibration manual milling environments. |
| Capacitive | Mitutoyo (Digimatic) | 1µm | Highly sensitive to electromagnetic interference (EMI) from VFDs; can cause ghost data spikes in monitoring dashboards. |
4-Step Operator Training Protocol for Networked DROs
To ensure seamless data flow from the machine's physical axes to the cloud-based monitoring dashboard, operators must follow this standardized daily and weekly protocol.
Step 1: Physical Scale Verification and Cleaning
Before logging into the monitoring software, the operator must verify the physical DRO scales. For glass scales, use a lint-free microfiber cloth dampened with 99% isopropyl alcohol (IPA). Never use standard shop rags, as they leave micro-fibers that the optical reader will interpret as axis movement, creating 'noise' in the monitoring software's position tracking. For magnetic scales (like the Newall Spherosyn), simply wipe away heavy chip buildup with a dry cloth; do not use solvents that might degrade the magnetic tape's protective coating.
Step 2: Network Latency and Handshake Verification
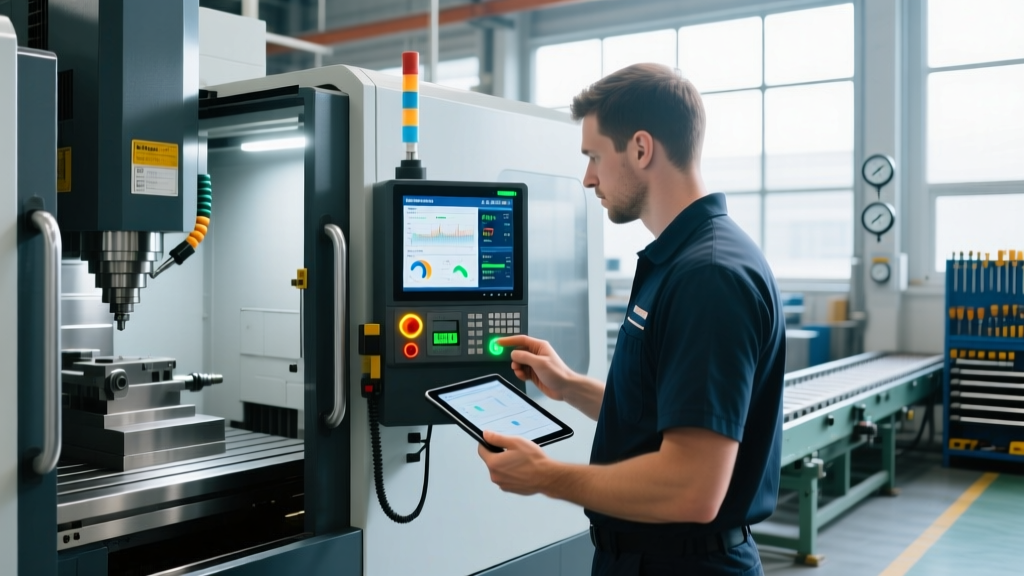
Modern DROs connect to machine tool monitoring software via shop-floor Ethernet drops or Wi-Fi edge gateways. Operators must verify the handshake upon machine startup. On a HEIDENHAIN ND 780, navigate to the Network Diagnostics menu and check the ping response to the local MTConnect adapter. The latency must remain below 15 milliseconds. If latency exceeds 50ms, the monitoring software will buffer data, leading to delayed cycle-time reporting and inaccurate OEE (Overall Equipment Effectiveness) calculations.
Step 3: MTConnect Polling Rate Configuration
Operators must understand the difference between polling rates. According to the MTConnect Institute, standard position tracking requires a 10Hz polling rate (10 samples per second). However, if the machine tool monitoring software is configured to capture high-speed tapping or rapid traverse data, the DRO adapter must be set to 50Hz or 100Hz. Training operators to adjust these parameters via the DRO's service menu prevents data bottlenecks on the shop floor's local network.
"The biggest mistake we see in 2026 is shops buying enterprise monitoring software but leaving the DRO polling rate at the factory default of 1Hz. At 1Hz, the software misses rapid traverse movements entirely, making manual cycle times look 20% longer than they actually are." — Senior Manufacturing Engineer, SME Technical Council
Step 4: Dashboard Alarm Threshold Mapping
Operators must map physical machine limits to software alarms. In the monitoring software's configuration portal, set the 'Axis Position Deviation' alarm to trigger if the DRO reports a position outside the soft limits programmed for that specific part setup. For a standard 3-axis Bridgeport retrofit, a deviation threshold of 0.002 inches (50 microns) is optimal for catching fixture bumps before the tool crashes into the workpiece.
Troubleshooting DRO-to-Software Communication Drops
When the machine tool monitoring software flags a DRO as 'Offline' or 'Stale Data', operators should execute the following decision tree before calling IT or maintenance:
- Symptom: DRO display is on, but software shows 'Offline'.
- Cause: Ethernet cable disconnected at the edge gateway, or IP address conflict on the shop floor DHCP server.
- Fix: Check the physical CAT6 connection at the DRO head. Restart the local edge gateway (typically a Raspberry Pi or industrial IPC mounted on the machine column).
- Symptom: Software shows 'Stale Data' (position not updating during manual handwheel movement).
- Cause: Linear scale read-head is blocked by a metal chip, or the RS-232 serial buffer is full.
- Fix: Clean the scale read-head. If using a legacy RS-232 connection, clear the serial buffer in the DRO settings and ensure the baud rate matches the adapter (usually 9600 or 19200 bps).
- Symptom: Erratic position spikes in the monitoring dashboard (e.g., X-axis jumps 2 inches instantly).
- Cause: Electromagnetic Interference (EMI) from a nearby VFD (Variable Frequency Drive) or welding equipment corrupting the capacitive scale signal.
- Fix: Ensure the DRO signal cables are shielded and routed at least 12 inches away from high-voltage spindle motor cables. Replace unshielded cables with foil-shielded, twisted-pair alternatives.
The ROI of Networked DRO Training
Retrofitting a standard manual knee mill with magnetic scales, an IoT-enabled DRO head, and an edge gateway costs between $3,800 and $5,200 in 2026. However, the cost of not training operators to maintain this data link is significantly higher. Unmonitored manual machines typically suffer from 15% to 22% unrecorded idle time. By training operators to actively manage the intersection of DRO readouts and machine tool monitoring software, shops can accurately bill manual labor to specific part numbers, predict linear scale failures before they cause scrap, and achieve true, facility-wide OEE transparency.
📋 Operator Shift-Start Checklist
- [ ] Wipe down all linear scales with approved solvent (no shop rags).
- [ ] Verify DRO network ping is < 15ms via the display diagnostics menu.
- [ ] Confirm MTConnect polling rate matches the current job's speed requirements (10Hz for standard milling, 50Hz for high-speed operations).
- [ ] Check the monitoring dashboard to ensure the machine status reads 'Idle' or 'Setup' and not 'Offline'.
- [ ] Verify soft-limit alarms are synced with the current fixture setup sheet.
For further reading on industrial data standards and advanced manufacturing integrations, operators and engineers should consult the NIST Advanced Manufacturing portal and review the latest HEIDENHAIN Digital Readouts documentation for specific firmware update procedures that enhance IoT connectivity.