Original Equipment Manufacturer Energy Ratings & ROI Cost Analysis
Analyze original equipment manufacturer energy ratings to optimize factory budgets. Learn how to calculate ROI on high-efficiency industrial machinery.
The Capex vs. Opex Illusion in Heavy Machinery
Industrial facilities consume nearly 30% of total U.S. electricity, with motor-driven systems and compressed air accounting for the lion's share of that load. When planning capital expenditures, budget analysts and plant managers often fixate on the initial purchase price, severely underweighting the energy efficiency ratings established by the original equipment manufacturer. This oversight leads to a phenomenon known as 'operational budget bleed,' where a cheaper upfront asset drains facility resources for a decade or more.
Evaluating machinery strictly on invoice cost ignores the Total Cost of Ownership (TCO). In many industrial applications, energy consumption accounts for 70% to 80% of a machine's lifecycle cost. Understanding how to decode, verify, and financially model the efficiency data provided by the original equipment manufacturer is the difference between a profitable production line and a continuous financial drain.
Budget Trap Warning: The Nameplate FallacyNameplate efficiency is measured under ideal laboratory conditions (e.g., 100% load, perfect alignment, ambient temperature of 25°C). Real-world partial loading, harmonic distortion from VFDs, and voltage imbalances can drop actual system efficiency by 8% to 15%. Always request the OEM's part-load efficiency curves, not just the peak nameplate rating, before approving a purchase order.
Decoding the Matrix: Standard vs. Premium OEM Equipment
To illustrate the financial divergence between standard and premium efficiency tiers, we must look at specific asset classes. Below is a comparative budget matrix analyzing two of the most common industrial assets: a 75 kW (100 HP) rotary screw air compressor and a 100 HP TEFC (Totally Enclosed Fan Cooled) induction motor.
| Asset & OEM Tier | Initial Capex | Annual Energy Cost | 5-Year TCO | ROI on Premium |
|---|---|---|---|---|
| 75kW Compressor (Fixed Speed) Standard OEM Baseline |
$28,000 | $68,400 | $370,000 | N/A |
| 75kW Compressor (VSD+) Premium OEM (e.g., Atlas Copco GA VSD+) |
$46,000 | $44,100 | $266,500 | 0.7 Years |
| 100HP Motor (IE2 High Eff.) Standard OEM (e.g., WEG W22 IE2) |
$4,200 | $82,540 | $416,900 | N/A |
| 100HP Motor (IE4 Super Premium) Premium OEM (e.g., WEG W22 IE4) |
$6,800 | $81,257 | $413,085 | 2.0 Years |
The Non-Obvious Insight: Why Motor Upgrades Often Fail ROI Tests
Notice the discrepancy in the table above. Upgrading to a premium VSD air compressor yields an almost immediate return on investment. However, upgrading a standalone 100HP motor from IE2 to IE4 yields a mediocre 2-year ROI, despite the 'Super Premium' label.
This is a critical budget planning insight: motor efficiency gains are strictly linear and bound by physics. A 100HP motor outputs 74.6 kW. An IE2 motor operates at ~95.2% efficiency (drawing 78.36 kW), while an IE4 operates at ~96.5% (drawing 77.30 kW). The maximum possible savings is roughly 1.06 kW. Unless that motor runs 24/7/365 (8,760 hours annually) at full load, the capex premium is rarely justified by energy savings alone. Budget planners should instead allocate that premium toward Variable Frequency Drives (VFDs) or system-level optimization, which offer exponential rather than linear savings.
Step-by-Step Total Cost of Ownership (TCO) Framework
To accurately forecast operational budgets, facility controllers must move beyond simple kWh multiplication. Follow this four-step framework when evaluating OEM proposals:
- Base Load Profiling: Never accept OEM baseline assumptions. Deploy power quality loggers (e.g., Fluke 1730) on your existing equipment for 14 days to capture true load profiles, including start-up spikes and idle times.
- Extract Part-Load Curves: Demand the original equipment manufacturer provide wire-to-air (for compressors) or wire-to-shaft (for motors) efficiency maps at 25%, 50%, 75%, and 100% load. Calculate weighted efficiency based on your specific profile.
- Apply Blended Rates with Demand Charges: Industrial electricity bills include peak demand charges (often $12 to $18 per kW of peak draw). Soft-starters and VFDs provided by premium OEMs drastically reduce inrush current, potentially shaving thousands off monthly demand penalties—a factor standard energy calculators ignore.
- Factor Maintenance Deltas: Premium OEM equipment often reduces mechanical shock. For example, a VSD compressor eliminates the aggressive load/unload cycling of fixed-speed units, extending airend bearing life and reducing oil carryover by up to 30%.
Leveraging ISO 50001 and Utility Incentives
High-efficiency OEM equipment carries a capex premium that can trigger sticker shock during board approvals. However, integrating your procurement strategy with recognized energy management standards can unlock significant offsetting capital.
'Facilities that align their capital equipment upgrades with ISO 50001 energy management frameworks not only systematize their continuous improvement but frequently qualify for tier-one utility rebates that can cover 30% to 50% of the premium equipment cost.'
According to the ISO 50001 standard guidelines, establishing a baseline and demonstrating measurable improvement through certified equipment upgrades is a primary requirement for maintaining certification. Furthermore, the U.S. Department of Energy's Advanced Manufacturing Office provides extensive resources and databases linking industrial motor and compressor upgrades to local utility incentive programs. Before finalizing an OEM purchase order, cross-reference the equipment's specific efficiency tier (e.g., NEMA Premium or CAGI Performance) with your local utility's commercial rebate matrix.
The RFQ Procurement Checklist for Budget Planners
Do not allow OEM sales representatives to dictate the efficiency narrative. When issuing a Request for Quote (RFQ) for heavy manufacturing equipment, mandate the inclusion of the following technical and financial data points to ensure accurate budget modeling:
- Guaranteed Specific Energy Requirement (SER): For compressed air or pumping systems, demand the SER (e.g., kW per 100 CFM) at your exact operating pressure, not the standard CAGI test pressure.
- Harmonic Distortion Limits (THDi): If the OEM equipment includes VFDs, require documentation on Total Harmonic Distortion. High THDi causes overheating in upstream transformers, silently increasing facility cooling costs and degrading power factor.
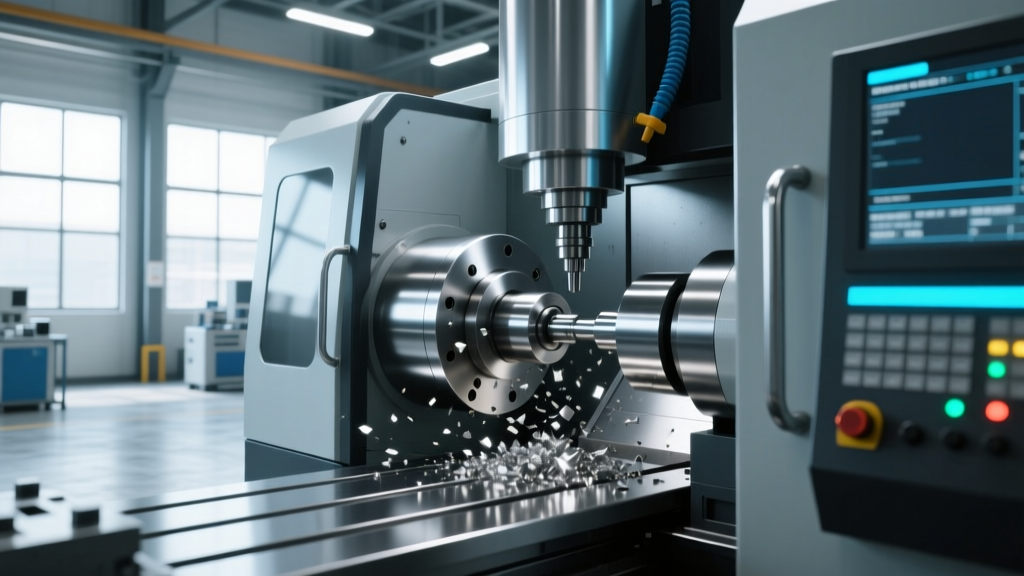
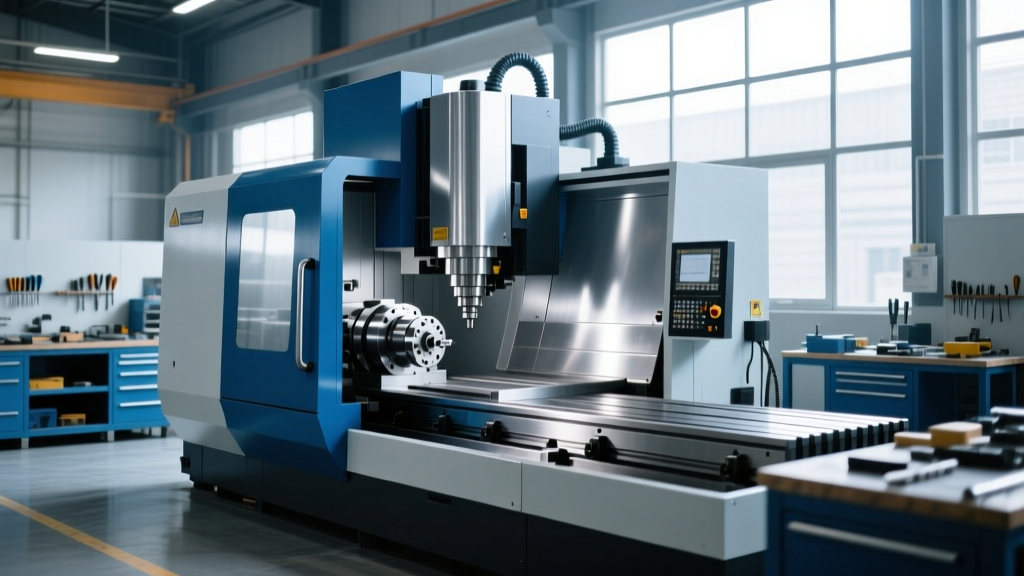
- Standby Power Draw: Modern CNC machines and automated production cells draw significant power in 'sleep' or 'standby' modes. Require the OEM to list exact standby kW consumption to calculate non-production energy bleed.
- Lubricant and Consumable Lifecycle Costs: High-efficiency gearboxes often require specialized synthetic lubricants. Factor the 5-year cost of OEM-mandated proprietary fluids into the TCO, as these can sometimes negate the electrical energy savings.
By treating the original equipment manufacturer's energy ratings not as marketing brochures, but as rigid financial variables, manufacturing budget planners can shift from reactive expense management to proactive margin optimization. The goal is not simply to buy the most efficient machine, but to buy the machine whose efficiency profile perfectly mirrors your facility's unique operational reality.