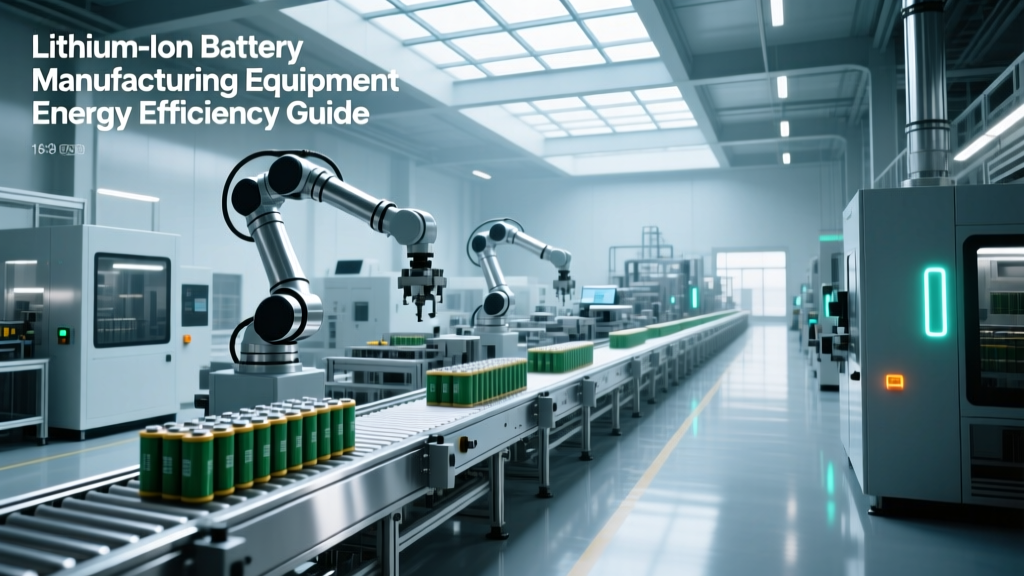
Lithium-Ion Battery Manufacturing Equipment Energy Efficiency Guide
Analyze energy efficiency ratings and operational costs for lithium-ion battery manufacturing equipment to optimize your production line budget.
The Hidden OpEx Trap in Battery Gigafactories
When procuring lithium-ion battery manufacturing equipment, plant managers and financial controllers often fixate on throughput rates, yield percentages, and initial capital expenditure (CapEx). However, the operational expenditure (OpEx) associated with energy consumption frequently derails long-term budget projections. A standard 10 GWh gigafactory can consume upwards of 150,000 MWh annually, translating to $12 million to $18 million in electricity costs alone, depending on regional industrial tariffs.
The energy footprint of lithium-ion battery manufacturing equipment extends far beyond the main drive motors. It encompasses thermal management systems, vacuum pumps, and the massive HVAC loads required to maintain ultra-low humidity environments. Understanding equipment energy efficiency ratings—specifically how they interact with facility-level infrastructure—is critical for accurate budget planning and achieving a viable cost-per-kWh of produced battery capacity.
Budget Alert: A 5% variance in the energy efficiency rating of your primary coating and calendering lines can result in a $400,000+ annual OpEx swing for a mid-sized 5 GWh facility operating at 85% utilization.Energy Consumption by Equipment Type: A Cost Matrix
To build an accurate budget, you must first map the energy draw of individual process steps. The table below breaks down the typical specific energy consumption (SEC) for major lithium-ion battery manufacturing equipment categories, alongside the estimated annual energy cost per GWh of production, assuming an industrial electricity rate of $0.11 per kWh.
| Equipment Category | Specific Energy (kWh/kWh cell) | Annual Cost (per GWh) | Primary Energy Driver |
|---|---|---|---|
| Double-Planetary Mixers (500L) | 0.8 - 1.2 | $88,000 - $132,000 | High-torque motors, cooling jackets |
| Slot-Die Coaters & Ovens | 3.5 - 5.0 | $385,000 - $550,000 | NMP solvent evaporation, web tension |
| Roll-to-Roll Calenders | 0.5 - 0.9 | $55,000 - $99,000 | Hydraulic presses, heated rolls |
| Formation & Aging Cyclers | 4.0 - 8.0* | $440,000 - $880,000 | Charge/discharge cycling, thermal mgmt |
| Dry Room HVAC (Dehumidifiers) | 12.0 - 18.0 | $1.3M - $1.9M | Desiccant wheels, chillers (-40°C DP) |
*Note: Formation cycler costs drop by up to 70% when utilizing regenerative bidirectional power supplies that feed discharge energy back into the facility grid.
Decoding IE Efficiency Ratings for Heavy Drives
The International Electrotechnical Commission (IEC) standard 60034-30-1 classifies motor efficiency into distinct tiers. When specifying heavy machinery like calenders and industrial mixers, understanding these tiers is non-negotiable for budget planning.
- IE1 (Standard Efficiency): Obsolete for new gigafactory builds. Banned in many jurisdictions for industrial applications.
- IE2 (High Efficiency): The legal minimum in most developed markets. Acceptable for auxiliary systems (conveyors, basic pumps) but inadequate for primary drives.
- IE3 (Premium Efficiency): The current baseline for heavy lithium-ion battery manufacturing equipment. Mandatory for motors above 0.75 kW in the EU and heavily incentivized in the US.
- IE4 (Super Premium Efficiency): Achieved via advanced copper rotors or permanent magnet synchronous motors (PMSM). Costs 15-25% more upfront but reduces slip and thermal losses significantly.
- IE5 (Ultra Premium): Emerging standard utilizing synchronous reluctance technology. Currently cost-prohibitive for most battery lines unless paired with highly specific continuous-duty applications.
According to the U.S. Department of Energy's Advanced Manufacturing Office, upgrading from IE2 to IE3 motors across a standard industrial plant yields a typical payback period of 1.5 to 3 years. However, in battery manufacturing, the continuous 24/7 duty cycle of mixing and coating lines compresses this payback window to 11 to 18 months.
CapEx vs. OpEx: Budgeting for Premium Efficiency
Financial controllers frequently push back on the 18-22% CapEx premium associated with IE4-rated drive systems and regenerative power supplies. To overcome this, budget proposals must model the Total Cost of Ownership (TCO) over a 7-year equipment lifecycle.
Case Study: Roll-to-Roll Calender Drive System
Consider a 1200mm wide calender requiring a 250 kW main drive motor operating at 90% load for 7,500 hours annually.
Standard IE3 Configuration
CapEx: $42,000
Efficiency: 95.2%
Annual kWh: 1,775,210
Annual Energy Cost: $195,273
7-Year TCO: $1,408,911
Upgraded IE4 PMSM Configuration
CapEx: $51,000
Efficiency: 96.8%
Annual kWh: 1,745,867
Annual Energy Cost: $192,045
7-Year TCO: $1,395,315
While the IE4 system commands a $9,000 premium at purchase, it generates a net savings of $13,596 over seven years in direct energy costs alone. This calculation completely ignores the secondary savings from reduced cooling requirements and extended bearing life due to lower operating temperatures.
The Dry Room Multiplier Effect
Critical Warning: Waste Heat and DehumidificationThe most overlooked factor in equipment energy budgeting is waste heat. Dry rooms for electrode manufacturing require dew points of -40°C to -50°C. Every kilowatt of electrical energy consumed by inefficient motors, hydraulic packs, or poorly insulated ovens is converted into waste heat. The facility's HVAC system must then expend an additional 0.8 to 1.2 kWh of cooling energy to remove that heat and maintain the stringent humidity parameters. Specifying high-efficiency, low-thermal-emission equipment effectively doubles your energy savings by reducing the downstream HVAC load.
When evaluating slot-die coaters, prioritize models with advanced heat recovery systems on the NMP (N-Methyl-2-pyrrolidone) evaporation ovens. Modern systems utilize enthalpy wheels to capture exhaust heat, pre-heating incoming fresh air and reducing the oven's thermal energy demand by up to 35%. According to assessments by the National Renewable Energy Laboratory (NREL), thermal optimization in coating and drying processes represents the single largest opportunity for energy reduction in cell manufacturing.
Regenerative Formation Cycling: The Ultimate ROI
Formation—the initial charging and discharging of the assembled cell to form the Solid Electrolyte Interphase (SEI) layer—is notoriously energy-intensive. Traditional formation cyclers dissipate the energy extracted during the discharge phase as heat through resistor banks.
Budgeting for regenerative bidirectional formation equipment is mandatory for modern gigafactories. These systems utilize high-frequency silicon carbide (SiC) inverters to push the discharge energy back into the facility's internal DC microgrid or AC mains. While a standard 5V/60A formation channel costs approximately $120, a regenerative channel costs closer to $180. However, the regenerative system boasts a grid-to-grid round-trip efficiency of 85-92%, compared to the 40-50% net efficiency of traditional systems when factoring in the cooling load required to dissipate the resistor heat.
Decision Framework: When to Specify Premium Efficiency
Use this matrix to determine when the CapEx premium for top-tier energy efficiency ratings is justified in your budget:
- Duty Cycle > 6,000 hours/year: Automatically specify IE4 or higher. The continuous operation guarantees sub-24-month payback.
- High Thermal Environments (Dry Rooms/Clean Rooms): Specify premium efficiency and water-cooled variants to minimize waste heat and reduce HVAC sizing requirements.
- Variable Load Profiles: Pair IE3/IE4 motors with variable frequency drives (VFDs). A premium motor running at a fixed speed via mechanical throttling wastes the efficiency gains.
- Auxiliary/Low-Draw Systems: Stick to IE2/IE3 for intermittent systems (e.g., scrap conveyors, batch-transfer pumps) where the CapEx premium will never be recovered through OpEx savings.
Strategic budget planning for battery manufacturing requires looking past the sticker price. By rigorously applying energy efficiency ratings to equipment specifications and modeling the secondary impacts on facility infrastructure, manufacturers can secure a distinct cost-per-kWh advantage in an increasingly commoditized market. For broader context on global industrial energy trends, the International Energy Agency's annual efficiency reports provide essential benchmarking data for heavy manufacturing sectors.