Cell Therapy Manufacturing Equipment Energy Costs & Efficiency
Analyze cell therapy manufacturing equipment energy efficiency ratings, TCO models, and OPEX budgeting for bioreactors, freezers, and cleanrooms.
The OPEX Reality of Bioprocessing Energy Loads
Margin compression in commercial cell therapy is no longer just a yield problem; it is an infrastructure problem. As facilities scale from Phase I clinical suites to commercial allogeneic production, the energy footprint of the facility becomes a top-three operational expenditure (OPEX), trailing only direct labor and raw media. When evaluating cell therapy manufacturing equipment, facility planners often default to upfront CAPEX and throughput metrics, ignoring the compounding energy costs that dictate long-term profitability.
In 2026, with industrial electricity rates averaging $0.14 to $0.19 per kWh across major biopharma hubs, the energy draw of ultra-low temperature (ULT) cold chains, ISO 7 cleanroom HVAC systems, and automated closed-system bioreactors directly impacts the Cost of Goods Sold (COGS). Budgeting for energy efficiency is not an environmental initiative; it is a critical financial safeguard.
Key Data Point: A standard 50,000 sq. ft. cell therapy manufacturing facility operating 24/7 consumes approximately 8.5 million kWh annually. At $0.16/kWh, that is $1.36 million in pure energy OPEX. Upgrading to high-efficiency equipment tiers can reduce this baseline load by 22% to 28%, yielding nearly $350,000 in annual savings.Decoding Efficiency Metrics in Cell Therapy Equipment
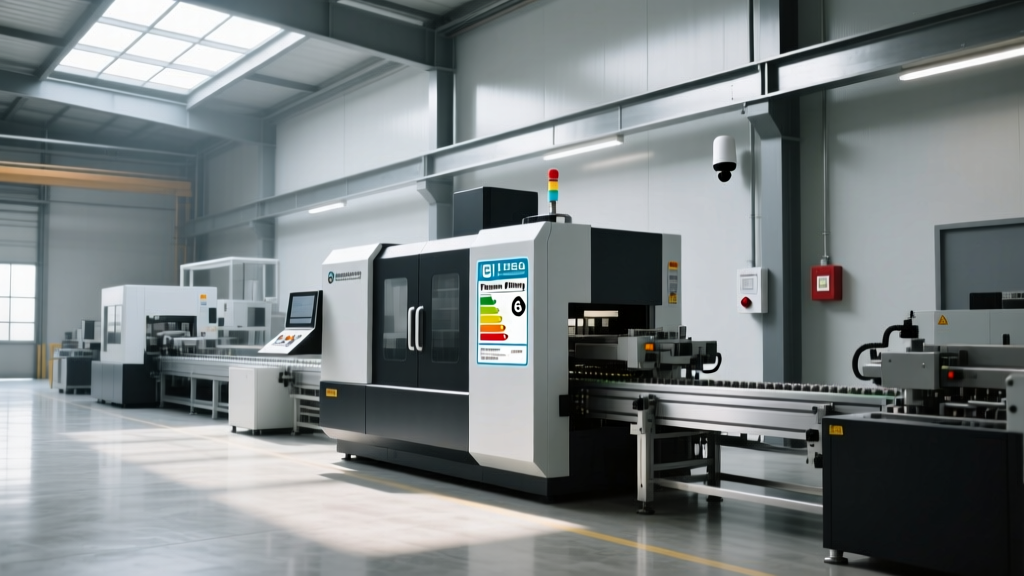
Unlike commercial appliances, bioprocessing equipment does not rely on standard consumer energy ratings. Instead, facility engineers must evaluate specific bioprocessing metrics to determine true efficiency. When reviewing equipment specifications, look for these three critical indicators:
- kWh per Batch (Autologous): For automated point-of-care or centralized autologous modules (e.g., Miltenyi CliniMACS Prodigy or Lonza Cocoon), measure the baseline standby draw plus the active cycle consumption. A 72-hour autologous run on an inefficient module can draw 18 kWh, whereas optimized units draw under 9 kWh.
- kWh per Liter of Harvest (Allogeneic): For perfusion bioreactors and chromatography skids, efficiency is measured against output volume. Variable Frequency Drive (VFD) pumps on systems like the Cytiva ÄKTA avant series reduce energy consumption by up to 35% during low-flow equilibration phases compared to fixed-speed pumps.
- Thermal Pull-Down Time vs. Steady-State Draw: For cold chain equipment, the energy required to return to -86°C after a 5-minute door opening is a massive hidden cost. High-efficiency units utilize vacuum-insulated panels (VIP) and hydrocarbon refrigerants to minimize thermal ingress.
CAPEX vs. OPEX: The 5-Year Total Cost of Ownership (TCO) Matrix
Procurement teams frequently reject high-efficiency equipment due to a 15% to 30% CAPEX premium. However, a 5-year TCO analysis reveals that the OPEX savings typically achieve payback within 2.4 years. Below is a comparative analysis of standard versus high-efficiency models across three critical equipment categories.
| Equipment Category | Standard Model Profile | High-Efficiency Model Profile | 5-Year Energy Savings |
|---|---|---|---|
| ULT Freezers (-86°C) e.g., PHCbi MDF-DU901VX-PE |
Fixed-speed compressor, polyurethane insulation. Draws ~16 kWh/day. | Inverter-driven compressor, VIP insulation. Draws ~5.5 kWh/day. | $13,800 (per unit) |
| CO2 Incubators e.g., Thermo Scientific Heracell VIOS 160i |
Water-jacketed, continuous heating elements. Draws ~4.2 kWh/day. | Direct-heat with eco-mode sleep cycles. Draws ~1.8 kWh/day. | $3,150 (per unit) |
| Chromatography Skids e.g., Cytiva ÄKTA process systems |
Standard AC induction motors on buffer delivery pumps. | Integrated VFDs and smart-pressure routing. | $8,400 (per skid) |
The Hidden Energy Sinks: Cleanroom HVAC and Cold Chain
While individual bioreactors and centrifuges draw measurable power, the supporting infrastructure dictates the true energy budget. Cell therapy requires stringent environmental controls to prevent microbial contamination and maintain vector viability.
1. ISO 7 and ISO 8 Cleanroom Air Changes
Traditional cleanrooms operate on a fixed Air Changes per Hour (ACH) model, typically pushing 40 to 60 ACH for ISO 7 spaces, regardless of room occupancy or active particle generation. This requires massive fan filter unit (FFU) arrays and 100% outside air makeup, leading to severe cooling and dehumidification loads.
Budgeting Strategy: Specify equipment layouts that allow for Demand Control Ventilation (DCV). By integrating real-time particle counters with the Building Management System (BMS), facilities can dynamically drop ACH to 15-20 during idle periods. According to the U.S. Department of Energy's Laboratory Energy Efficiency guidelines, dynamic ACH control can reduce cleanroom HVAC energy consumption by up to 40% without compromising ISO certification.
2. The 'Vampire Draw' of Automated Modules
Closed-system cell therapy platforms are designed to be left on 24/7 to maintain sterile boundary integrity and software connectivity. However, older generation automated modules exhibit severe 'vampire draw'—consuming 60% to 80% of their peak operational wattage while in standby mode. When budgeting for a suite of 20 automated modules, specify hardware with advanced sleep-state power management that drops standby consumption below 150 watts.
Procurement Warning: Do not rely solely on manufacturer nameplate wattage for budget planning. Nameplates list maximum theoretical draw (e.g., all heaters, compressors, and centrifuges running simultaneously). Always request the 'Annualized Energy Consumption' (AEC) test data based on IEC 62301 standby testing or equivalent bioprocessing duty-cycle profiles before finalizing CAPEX approvals.Budgeting Framework: Calculating the Energy ROI
To justify the CAPEX premium of high-efficiency cell therapy manufacturing equipment to financial stakeholders, facility planners must use the Net Present Value (NPV) of Energy Savings framework. Follow this step-by-step calculation for your budget proposals:
- Establish the Baseline Load: Calculate the annual kWh of the standard equipment model based on a 350-day operational year (accounting for maintenance downtime).
- Apply the Local Blended Rate: Use your facility's specific blended industrial electricity rate (incorporating peak demand charges, not just base kWh rates). In high-cost regions like California or the Northeast US, this can exceed $0.22/kWh.
- Factor in HVAC Rejection Loads: Every watt of electricity consumed by equipment inside a cleanroom is converted into heat. The HVAC system must expend roughly 0.35 watts of cooling energy to remove 1 watt of equipment heat. Always multiply equipment energy savings by 1.35 to capture the true facility-level savings.
- Calculate NPV: Discount the 10-year projected energy savings at your company's internal rate of return (typically 8% to 12%). If the NPV of the energy savings exceeds the CAPEX premium, the high-efficiency model is financially mandatory.
Real-World Scenario: Scaling to Phase III
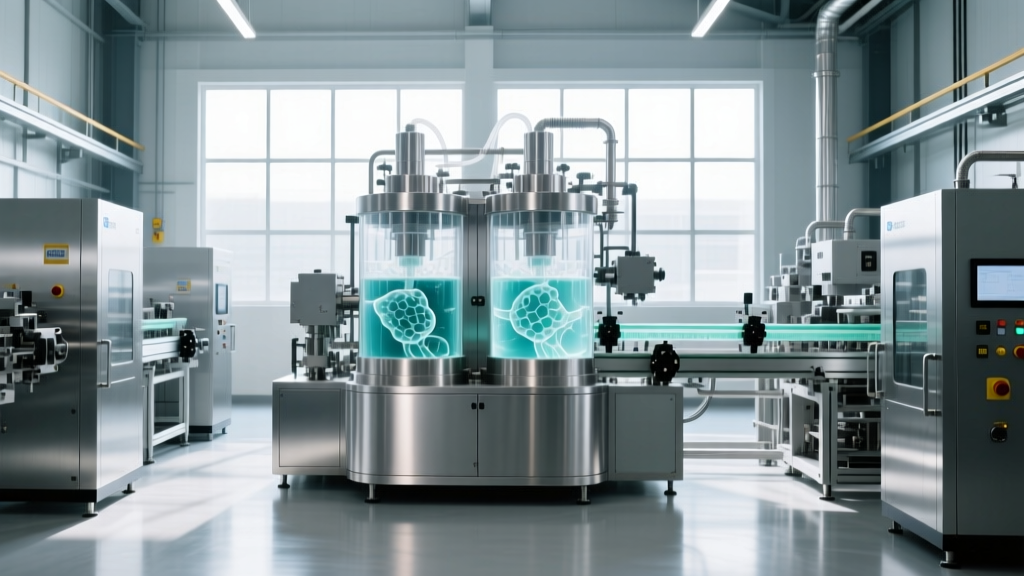
Consider a facility expanding its viral vector production from two 500L single-use bioreactors to eight 2000L perfusion systems. The standard cooling jackets and agitation motors on the larger vessels will increase the localized thermal load by 45 kW. If the facility's chiller plant operates at a coefficient of performance (COP) of 4.0, this requires an additional 11.25 kW of continuous compressor power. By specifying high-efficiency EC (electronically commutated) motors and optimized heat-exchange jackets during the initial equipment tender, the facility avoids a $1.2 million secondary upgrade to the central chiller plant infrastructure.
Strategic Sourcing and Sustainability Mandates
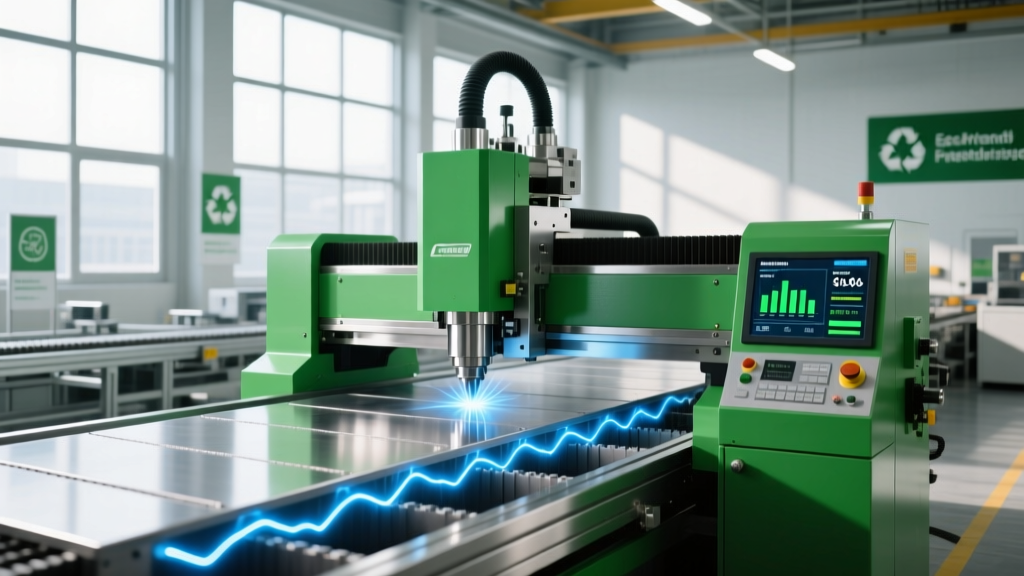
Beyond direct OPEX reduction, energy efficiency ratings are increasingly tied to regulatory and corporate sustainability mandates. The International Society for Pharmaceutical Engineering (ISPE) actively promotes sustainable manufacturing practices, noting that Scope 2 emissions (purchased electricity) are the primary target for biopharma carbon reduction goals. Equipment that features integrated energy-monitoring dashboards allows facility managers to export precise kWh-per-batch data directly into corporate ESG reporting software, streamlining compliance and avoiding costly third-party energy audits.
Ultimately, integrating energy efficiency into the procurement strategy for bioprocessing hardware transforms a static utility bill into a controllable variable. By demanding rigorous duty-cycle data, calculating true thermal rejection loads, and leveraging VFD and inverter technologies, manufacturing directors can secure the margins necessary to make life-saving cell therapies commercially viable.
"In cell therapy, where batch sizes are small and margins are razor-thin, the cost of electricity is not an overhead line item—it is a direct component of the therapy's COGS. Ignoring equipment efficiency is leaving margin on the table." — Adapted from industry analyses on bioprocessing economics, BioProcess International.