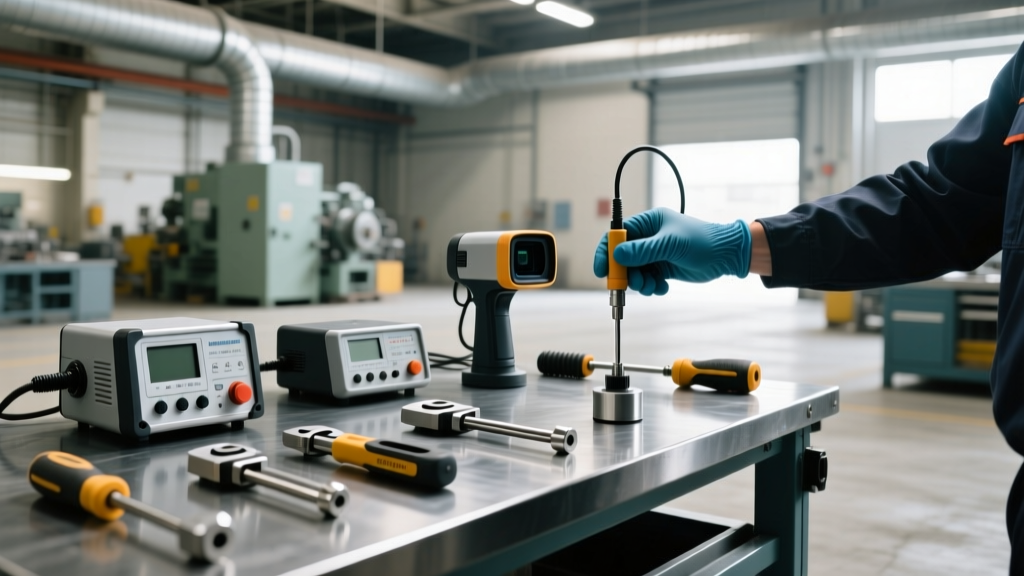
Industrial Equipment Maintenance Cost Analysis & Budget Framework
Master industrial equipment maintenance budgeting with RAV benchmarks, CapEx tooling costs, labor burden formulas, and predictive maintenance ROI models.
The Financial Reality of Asset Reliability
Allocating capital for industrial equipment maintenance requires moving beyond historical spend-and-replace models. In 2026, supply chain volatility for critical spare parts and the rising fully-burdened cost of specialized technical labor demand a mathematically rigorous approach to budget planning. Facilities that treat maintenance as a variable cost center rather than a strategic reliability function consistently experience margin erosion through unplanned downtime and emergency procurement premiums.
According to the Society for Maintenance & Reliability Professionals (SMRP), the divergence between world-class and reactive maintenance programs is measurable in direct percentage points of asset value. This framework provides the exact metrics, cost matrices, and ROI calculations required to build a defensible, data-driven maintenance budget.
The 5% RAV Rule: If your total annual maintenance spend (labor + parts + contracted services) exceeds 5% of your facility's total Replacement Asset Value (RAV), your program is statistically likely to be reactive and over-budgeted in emergency spend, despite under-investing in preventive technologies.The RAV Benchmark: Calculating Your Baseline
Replacement Asset Value (RAV) is the current market cost to replace a piece of equipment with a modern equivalent, not its depreciated book value. Using depreciated value artificially inflates your maintenance efficiency metrics and masks underlying reliability issues.
SMRP Maintenance Cost Benchmarks
| Program Maturity | Maintenance Cost as % of RAV | Inventory Carrying Cost Profile | Planned vs. Unplanned Work Ratio |
|---|---|---|---|
| World-Class (Proactive) | 1.5% - 3.0% | Optimized (VMI & Consignment heavy) | 90% Planned / 10% Unplanned |
| Average (Transitional) | 3.1% - 5.0% | Moderate (High safety stock on criticals) | 70% Planned / 30% Unplanned |
| Reactive (Run-to-Fail) | 6.0% - 12.0%+ | Bloated (Expensive obsolete spares hoarding) | 40% Planned / 60% Unplanned |
To calculate your facility's RAV, conduct an asset registry audit. For a CNC machining cell with three 5-axis mills (current market price $250,000 each) and supporting automated material handling ($150,000), the cell RAV is $900,000. A world-class maintenance budget for this specific cell should not exceed $27,000 annually.
Strategy Cost Matrix: Reactive vs. Preventive vs. Predictive
Budgeting requires matching the maintenance strategy to the asset's criticality. Applying predictive maintenance (PdM) to non-critical assets destroys ROI, while applying run-to-fail strategies to bottleneck machinery guarantees catastrophic financial loss.
| Strategy | Best Application | CapEx Requirement | OpEx Profile | Financial Risk Factor |
|---|---|---|---|---|
| Run-to-Fail (RTF) | Non-critical, redundant, or low-cost assets (e.g., shop fans, secondary coolant pumps) | $0 | Low (Sporadic replacement parts) | Low (Redundancy absorbs downtime) |
| Preventive (PM) | Assets with known, linear degradation curves (e.g., hydraulic filters, drive belts) | Low (Basic hand tools, CMMS software) | High (Scheduled labor, premature part disposal) | Moderate (Risk of infant mortality from intrusive PMs) |
| Predictive (PdM) | Critical bottleneck assets with random failure modes (e.g., main drive gearboxes, high-speed spindles) | High (Sensors, analyzers, IIoT integration) | Low (Targeted interventions only) | High initial CapEx, lowest long-term OpEx |
Tooling and Technology CapEx for Condition Monitoring
Transitioning from calendar-based PM to condition-based PdM requires upfront capital expenditure. When building your budget, specify exact tooling tiers based on your internal technical capabilities. Buying a $15,000 vibration analyzer is a wasted expense if the maintenance team lacks ISO 18436-2 certified vibration analysts to interpret the FFT spectra.
- Tier 1: Route-Based Handhelds (Entry-Level PdM)
Equipment: Fluke 810 Vibration Tester or SKF Microlog CMXA 51.
Cost: $7,500 to $14,500 per unit.
Use Case: Monthly routes on standard 1800 RPM motors and direct-drive pumps. The Fluke 810 provides automated diagnostics, reducing the need for advanced analyst training. - Tier 2: Advanced Acoustic & Thermal Imaging
Equipment: Fluke TiS60+ Thermal Imager ($5,200) and UE Systems UltraTrak ($3,100).
Cost: ~$8,300 combined.
Use Case: Electrical panel inspections for loose connections and compressed air leak quantification. A single undetected 3mm compressed air leak costs roughly $1,800 annually in wasted electricity; the ultrasonic tool pays for itself by identifying just five leaks. - Tier 3: Continuous Online Monitoring (IIoT)
Equipment: Emerson AMS 6500 ATG or SKF Multilog IMx.
Cost: $25,000 to $45,000+ per monitored machine (including software licensing and integration).
Use Case: Mission-critical, hard-to-reach, or high-hazard assets where manual data collection is unsafe or impractical.
Calculating the Fully Burdened Labor Rate
A common budgeting error is using the base hourly wage for maintenance labor calculations. To accurately forecast PM and PdM labor costs, you must calculate the fully burdened rate. For a specialized industrial millwright or mechatronics technician with a base wage of $45.00/hour, the actual cost to the facility is significantly higher.
Burden Multiplier Formula: Base Wage + FICA (7.65%) + Workers Comp (varies, avg 2.5%) + Health/Dental/Vision ($8.50/hr equivalent) + 401k Match (4%) + PTO/Holiday accrual (10%).Result: A $45.00/hr base wage translates to a $66.50/hr fully burdened rate. When calculating weekend overtime for scheduled shutdowns, apply the 1.5x multiplier to the base rate, then add the fixed burden, resulting in an effective OT rate of roughly $89.00/hr.
Hidden Budget Killers in Industrial Equipment Maintenance
Standard budgets account for filters, lubricants, and bearings. However, Plant Engineering's annual maintenance studies consistently highlight secondary costs that derail financial forecasts. Ensure your budget includes line items for the following edge cases:
- Control System Obsolescence Migrations: Legacy PLCs (e.g., Allen-Bradley PLC-5 or early SLC 500 series) are increasingly unsupported. Migrating a single production cell to a modern ControlLogix architecture requires new I/O modules, rewiring, and HMI reprogramming. Budget $35,000 to $65,000 per cell for proactive obsolescence management before a catastrophic motherboard failure forces an emergency migration at a 40% premium.
- Expedited Freight for Large-Bore Bearings: Standard lead times for specialized heavy machinery bearings (such as Schaeffler/FAG spherical roller bearings for large rotary kilns or paper machines) can stretch to 16-20 weeks. If an unexpected failure occurs and the part is not in local stock, air-freighting a 400 lb bearing from Germany or Japan can add $4,000 to $8,000 in logistics costs alone.
- Lubrication Cross-Contamination Remediation: Mixing incompatible grease thickeners (e.g., polyurea and lithium complex) causes catastrophic bearing seizures. Budgeting for annual lubrication system flushes, desiccant breather replacements, and oil varnish analysis (MPC testing) prevents $50,000+ gearbox rebuilds.
ROI Modeling: The Business Case for Predictive Maintenance
To justify the CapEx of condition monitoring tools to financial stakeholders, use the Unplanned Downtime Avoidance model. This aligns with ISO 55000 Asset Management standards, which require demonstrating value realization from asset management decisions.
Case Study: Haas VF-4 CNC Mill Spindle Failure
Scenario: A high-speed 12,000 RPM spindle on a critical aerospace milling center begins showing early signs of bearing degradation.
The Reactive Cost (Run-to-Failure):
- Replacement Spindle Assembly: $6,800
- Emergency Expedited Shipping: $450
- Unplanned Machine Downtime (16 hours @ $850/hr lost production margin): $13,600
- Reactive Labor (12 hours standard @ $66.50/hr burdened): $798
- Total Reactive Cost: $21,648
The Predictive Cost (Vibration Analysis Catch):
Vibration analysis detects a 2x running speed peak indicating early bearing wear. The spindle is ordered via standard freight and scheduled for replacement during a planned weekend shutdown.
- Replacement Spindle Assembly: $6,800
- Standard Shipping: $0 (Covered by standard freight terms)
- Unplanned Machine Downtime: $0 (Executed during non-production hours)
- Planned Weekend OT Labor (8 hours @ $89.00/hr effective OT rate): $712
- Total Predictive Cost: $7,512
Net Financial Gain: By catching the failure mode early, the facility saves $14,136 on a single asset intervention. If a $12,000 vibration analyzer prevents just one such failure per year, the tool achieves a positive ROI in under 11 months, completely validating the CapEx allocation in the annual budget.
Executing the Budget Allocation
Finalizing your maintenance budget requires mapping these costs directly to your Asset Criticality Ranking (ACR). Allocate 70% of your PdM technology budget to 'A-Critical' assets (those that halt production or create safety/environmental hazards). Dedicate 20% to 'B-Essential' assets (those that degrade throughput but have partial redundancy), and restrict the final 10% to 'C-Ancillary' assets. By anchoring your industrial equipment maintenance spend to verifiable RAV metrics and precise labor burden calculations, you transition the maintenance department from a discretionary cost center to a quantifiable profit protector.