The Machine Tools Icon in Industry 4.0 Safety Dashboards
Learn how to design compliant Industry 4.0 dashboards. We cover IEC 61310 standards, OPC UA latency handling, and machine tools icon safety rules.
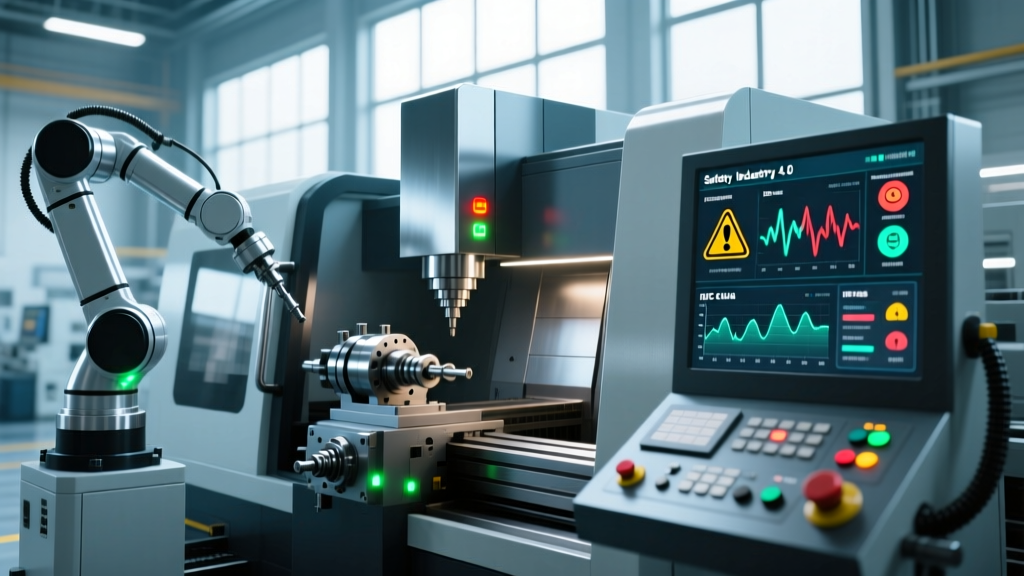
The transition from isolated shop floors to hyper-connected smart factories has fundamentally altered how operators interact with heavy machinery. Legacy three-tier stack lights are being replaced by centralized SCADA systems and edge-computing dashboards. In this digital environment, the machine tools icon serves as the primary visual anchor for operators monitoring multiple CNC mills, lathes, and automated grinding cells. However, treating this icon as a mere graphic design element is a critical compliance failure. Under modern Industry 4.0 safety frameworks, the digital representation of machine state is governed by stringent human-machine interface (HMI) standards.
When a dashboard fails to accurately reflect the physical state of a machine tool due to network latency or poor UI design, the consequences can be fatal. This guide dissects the intersection of IEC 61310, OPC UA data modeling, and visual safety compliance, providing actionable frameworks for engineering teams building smart manufacturing dashboards.
IEC 61310 and the Digital Machine Tools Icon
Historically, safety indicators were physical. Today, ISO 13849-1 and IEC 61310 dictate how safety-related information must be presented to human operators, regardless of whether that presentation is a hardwired LED or a pixel on a 4K dashboard monitor. IEC 61310 specifically addresses the safety of machinery regarding human-system interaction, mandating that visual signals must be unambiguous, prioritized, and instantly recognizable.
For the machine tools icon on a central HMI, this means the icon cannot simply be a static vector graphic of a milling machine. It must be a dynamic, state-aware data object that adheres to strict colorimetry and temporal (blinking) rules defined by IEC 60073.
⚠ Compliance Warning: The 'Green' TrapA common violation in early Industry 4.0 deployments is leaving the machine tools icon green (indicating 'Safe/Running') when the OPC UA connection drops. If an operator approaches a machine believing it is in a safe idle state based on a frozen green icon, they bypass physical safety interlocks. Digital icons must default to a 'Stale/Unknown' visual state upon packet loss.
Colorimetry and Temporal Signaling Rules
To achieve compliance, HMI developers must map backend telemetry to precise visual outputs. The OSHA machine guarding guidelines and international IEC standards require specific chromaticity coordinates for safety signaling. While exact CIE 1931 color space coordinates are used for physical lights, digital dashboards must approximate these using strict HEX codes and contrast ratios against the dashboard background.
Mandatory Color Mapping for Smart Dashboards
- Red (#FF0000): Danger, emergency stop engaged, or safety interlock breached. Requires immediate operator intervention.
- Yellow (#FFFF00): Warning, abnormal condition (e.g., spindle vibration exceeding 4.5 mm/s RMS), or maintenance required.
- Green (#00FF00): Safe condition, normal automated cycle running, or machine in a verified zero-energy state.
- Blue (#0000FF): Mandatory action required (e.g., operator must scan a badge to unlock the tool changer).
- Grey/Hatched (#808080 with 45-degree lines): Data stale, network disconnected, or HMI heartbeat lost.
Blink Frequencies and Prioritization
Static colors are insufficient for high-priority alarms. IEC 60073 mandates specific pulse rates to differentiate alarm severity without causing operator fatigue or photosensitive reactions. High-priority safety faults (e.g., a light curtain breach on a press brake) must trigger a fast blink on the machine tools icon at 2 Hz to 5 Hz (on/off ratio 1:1). Low-priority warnings (e.g., coolant level at 15%) should utilize a slow pulse of 0.5 Hz.
Physical Stack Lights vs. Digital HMI Compliance
Understanding the compliance delta between physical indicators and digital icons is crucial for systems integrators. The table below maps legacy hardware states to their required digital equivalents under ANSI/ISA-18.2 alarm management standards.
| Machine State | Legacy Physical Indicator | Industry 4.0 Digital Icon State | Required HMI Action |
|---|---|---|---|
| E-Stop Engaged | Solid Red Beacon | Icon outline Red (#FF0000), 3Hz blink | Modal pop-up, audible 85dB alarm |
| Spindle Overload | Solid Yellow Beacon | Icon fill Yellow (#FFFF00), static | Dashboard banner, log to CMMS |
| Safe Idle (Zero Energy) | Solid Green Beacon | Icon fill Green (#00FF00), static | Enable digital 'Unlock Door' button |
| MQTT/OPC UA Timeout | N/A (Hardware independent) | Icon Grey (#808080) with diagonal slash | Disable all remote actuation controls |
The Latency Trap: MTConnect, OPC UA, and Ghost States
The most significant safety risk in smart machine tool connectivity is network latency and packet loss. In a physical setup, a severed wire to a stack light results in the light turning off—an obvious failure. In an Industry 4.0 setup, a severed Ethernet cable between the edge gateway and the SCADA server leaves the dashboard displaying the last known state. This creates a 'Ghost State,' where the machine tools icon shows a safe green idle, while the physical machine is actually faulted or, worse, in an unmonitored active cycle.
To comply with safety-critical HMI design principles, developers must implement Last Will and Testament (LWT) protocols in MQTT or utilize the Session Timeout mechanisms in OPC UA.
Implementing Stale Data Visualizations
When utilizing MTConnect or OPC UA to feed the dashboard, the HMI frontend must run an independent heartbeat timer. If the telemetry payload does not update within the predefined threshold (typically 2,000ms to 5,000ms depending on the machine's cycle time), the UI must automatically strip the color from the machine tools icon. Applying a CSS greyscale filter and overlaying a hatched SVG pattern instantly communicates to the operator that the data is unverified, prompting a physical line-of-sight check before approaching the work envelope.
Hardware Interlocks vs. Digital Monitoring
A critical misunderstanding in Industry 4.0 integration is attempting to use the HMI dashboard to execute safety-critical functions. Digital icons and software dashboards are strictly for monitoring and supervisory control. They cannot replace physical safety relays.
'Software-based safety signals transmitted over standard Ethernet cannot achieve the SIL 3 or Performance Level e (PLe) required for life-safety interlocks on heavy cutting machinery. The digital dashboard must reflect the state of the physical safety controller, never act as the controller itself.'
— Systems Engineering Guidelines for Networked Safety
For example, if an operator clicks a 'Reset Fault' button next to the machine tools icon on the dashboard, that command must be routed to a certified safety controller, such as a Pilz PNOZmulti 2 or a Beckhoff TwinSAFE terminal. The safety controller will then physically verify that all light curtains are clear and guard doors are locked before sending a boolean Reset_OK signal back to the OPC UA server, which subsequently updates the machine tools icon from Red to Green. Bypassing this hardware verification loop to save on integration costs is a direct violation of ANSI B11.19 and ISO 13849.
5-Step HMI Safety Compliance Audit
Engineering managers and safety officers should conduct the following audit on all smart factory dashboards to ensure the machine tools icon and surrounding UI elements meet current compliance standards:
- Verify Heartbeat Logic: Disconnect the edge gateway from the network. Confirm that the dashboard icons transition to a 'Stale/Grey' state within 5 seconds. If they remain green or red, fail the audit.
- Test Color Contrast Ratios: Use WCAG 2.1 contrast checkers on the HMI monitors in the actual shop floor lighting conditions (often 500+ lux). Ensure the red and yellow fault states maintain a minimum 4.5:1 contrast ratio against the dashboard background.
- Audit Blink Frequencies: Record the screen with a high-framerate camera and count the blink cycles of a simulated E-Stop event. Ensure it falls strictly within the 2 Hz to 5 Hz IEC 60073 mandate.
- Validate Actuation Interlocks: Attempt to trigger a machine cycle start via the dashboard while physically holding a guard door open. The hardware safety relay must block the command, and the icon must reflect the 'Interlock Breach' state, not a 'Command Pending' state.
- Review Alarm Prioritization: Trigger a low-priority alarm (e.g., low way-lube) and a high-priority alarm (e.g., axis over-travel) simultaneously. Ensure the high-priority alarm overrides the visual state of the machine tools icon and suppresses the lower-priority visual clutter.
Designing the machine tools icon for an Industry 4.0 dashboard is an exercise in safety engineering, not just user interface design. By strictly adhering to IEC 61310 colorimetry, implementing robust network-drop visualizations, and maintaining a hard boundary between digital monitoring and physical safety actuation, manufacturers can deploy smart dashboards that enhance productivity without compromising operator safety.